


Increase Your Decision-Making Power with i-frame Dashboard Designer
Dashboard Designer is a design tool for creating user-specific dashboards that allow information from multiple data sources to be presented in a visual, interactive and meaningful way. Its purpose is not only to show the data, but also to make sense of it and shed light on decision support processes.
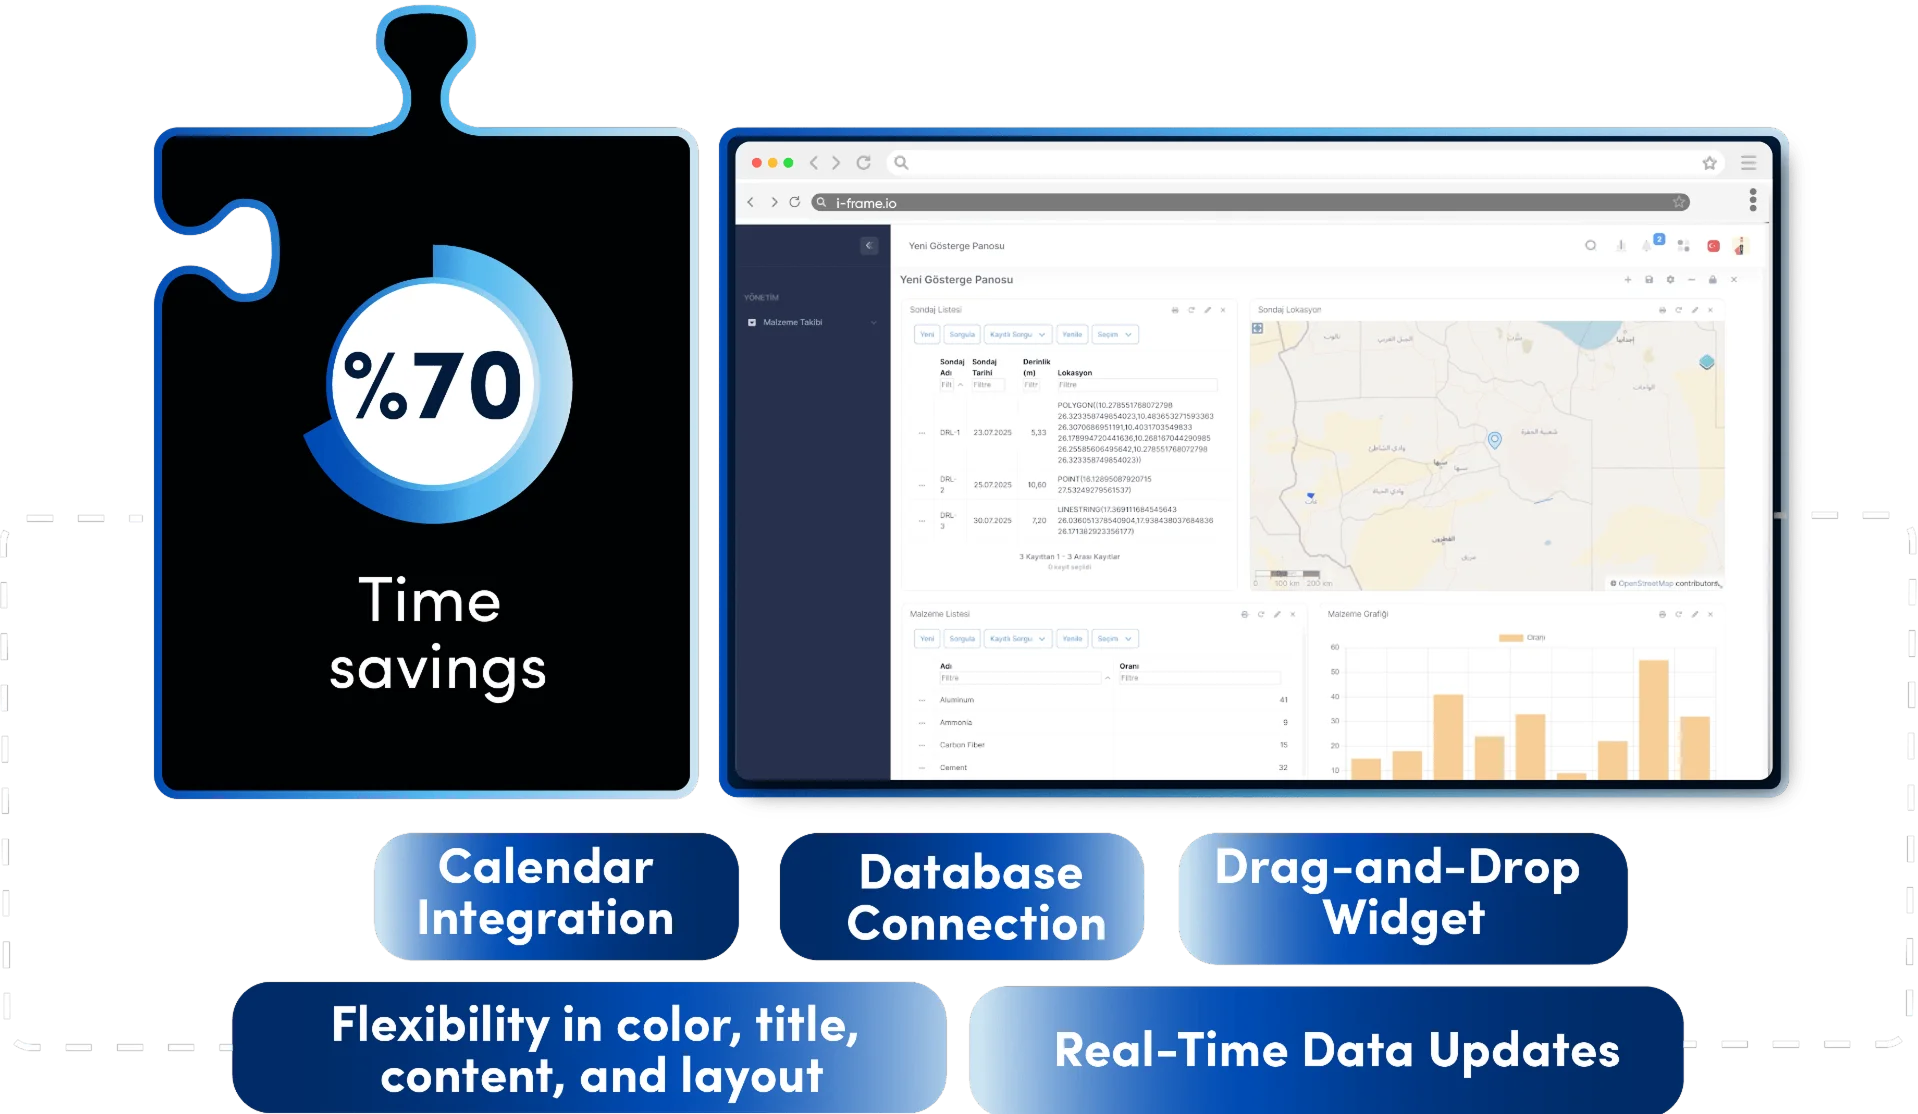
Employee data access and reporting time
The Difference Between Traditional Methods and i-frame
Dashboards were mostly created with standalone BI (Business Intelligence) tools or Excel-based charts. Each change required pulling data from an external system, reorganizing reports, and even updating visuals. This process required both technical knowledge and time.
How i-frame Transforms This Process
i-frame’s Dashboard Module offers real-time visualization with widgets that connect directly to the data source. Drag-and-drop elements such as charts, tables and maps can be easily integrated into user-specific dashboards. Thus:
- Data-driven decisions can be made instantly,
- With graphical expression, information turns into insight,
- Non-technical roles as well as technical users have access to the data.
Empowering businesses with flexible Dashboard Designer solutions
Ease of Use and Integration Capability
| Feature | Traditional Methods | i-frame |
|---|---|---|
| Chart Creation | Code or external BI software | Drag-and-drop widget interface |
| Data Connection | Manual transfer with external systems | Direct database connection |
| Scheduled Update | May require manual refresh | Real-time data updates |
| Customization | Limited | Flexibility in color, title, content, and layout |
| Calendar / Time Components | Separate applications | Integrated with built-in calendar module |
| External Page Integration | Requires coding | Support for embedding external web content |
Key Features
Drag-and-Drop Widget Builder
Graphs, tables, counters, maps, calendars in one
Map Supported Visualization (GIS Integration)
Geographic data is visualized to provide insights into the field
Calendar Integration
Built-in calendar module for time-based planning and event management
External Page Embedding
Integration of outsourced visual, text or iframe content into the panel
Real-time Data Streaming
Delay-free decision support with instantly updated dashboards
User Specific Designs
Authorization-based content control and personal dashboards
Mobile Compatibility
Each screen works responsively, can be used independently of the device
Where is i-frame used?
- Production performance reports (e.g. KPI tracking at cement or mining sites)
- Corporate strategy indicators (balanced scorecard structures)
- Operational tracking systems (requests, approvals, SLA times)
- Management-specific decision support dashboards
- Dynamic dashboards with map-based GIS data
- Planning and task control screens integrated with calendar

Who is using it?
- Senior Executives: Those who want simple and meaningful visualization for instant decisions
- Data Analysts: Generating deep insights through filtering, time series and correlations
- IT and Reporting Professionals: Those who customize widgets to deliver tailored experiences to the user
- Business Units: Operational managers who create their own dashboards without the need for technical knowledge

Advantages of Using i-frame
- Makes it easier to make sense of data by visualizing it
- Accelerates decision-making with real-time insight
- Provides an interoperable environment for technical and non-technical users
- Provides simple, effective and reliable reports to managers and team leaders
- Provides a holistic organizational perspective by combining internal and external resources
- Offers a tailored, flexible and fast structure
- Security and privacy standards are maintained with user-specific authorization